The Windows Task Manager: Understanding and Using All its Elements
Our experts cover all you must know about the utility
Highlights
- The Windows Task Manager provides real-time information about a PC’s processes, applications, and services
- Users can monitor and manage the system’s performance, resources, and processes.
Opening the Task Manager
To open the Task Manager, you can use one of several methods:
- Press Ctrl + Shift + Esc on your keyboard.
- Press Ctrl + Alt + Del then choose Task Manager from the options.
- Right-click your Taskbar and choose Task Manager from the context menu.
- Use the Windows key + X shortcut and select Task Manager from the menu.
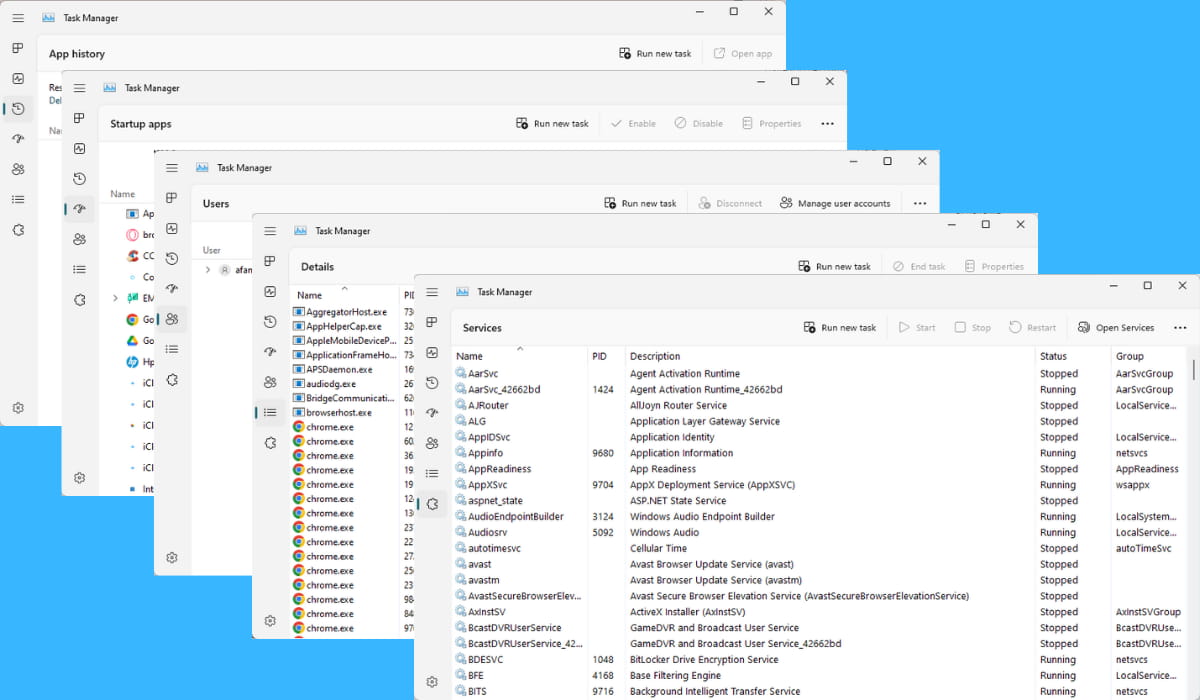
Once the Task Manager is open, you will see the following tabs: Processes, Performance, App history, Startup, Users, Details, and Services.
Let’s look at each of these tabs and what they contain.
1. The Task Manager Processes tab
The Processes tab is the default tab that opens when you launch the Task Manager.
It lists all the processes currently running on your system, including the name, PID (process identifier), CPU usage, memory usage, and more.
1.1 Understanding process information on Task Manager

- Name: This column shows the name of the process or application. If you’re not sure what a process does, you can right-click on it and select Search online to look it up.
- PID: This column displays the unique process identification number assigned to each process by the operating system.
- CPU: This column displays the percentage of CPU usage for each process. It shows how much of the processor’s time each process is currently using.
- Memory: This column displays the amount of memory, in kilobytes (KB), being used by each process.
- Disk: This column displays the amount of data being read from or written to the disk by each process.
- Network: This column displays each process’s amount of network activity (sent or received).
1.2 Managing Task Manager processes

The Processes tab allows you to manage running processes in several ways:
- End Task: You can right-click on a process and select End task to close the process. This is useful if an application is unresponsive or causing issues.
- End Process Tree: This option ends the process and any child processes it has spawned. This can be useful if an application has multiple processes running that you want to close simultaneously.
- Set Priority: You can right-click on a process and select Set priority to change the priority level of the process. This can help if you want to allocate more or fewer system resources to a specific process.
- Set Affinity: You can right-click on a process and select Set affinity to control which CPU cores the process can use. This is useful to restrict a process to only one or some specific CPU cores.
1.3 Analyzing Task Manager process performance
The Processes tab also provides several features for analyzing the performance of running processes:
- CPU Usage: You can sort the process list by CPU usage to see which processes use the most CPU resources at any given time.
- Memory Usage: You can sort the process list by memory usage to see which processes use the most memory resources at any given time.
- Resource Monitor: You can click the “Resource Monitor” button at the bottom of the Processes tab to open the Resource Monitor. This tool provides a more detailed view of system resources used by running processes, including CPU, memory, disk, and network usage.
2. The Task Manager Performance tab
The Performance tab provides a real-time view of the system’s performance metrics, including CPU usage, memory usage, disk activity, and network activity. This tab can monitor the system’s performance and identify potential issues.

2.1 CPU
The CPU section of the Performance tab shows a graph of the current CPU usage and a breakdown of usage by individual cores. You can also see which processes use the most CPU resources at any time.
2.2 Memory
The Memory section of the Performance tab shows a graph of the current memory usage and a breakdown of usage by different types of memory, such as physical memory (RAM), virtual memory (paging file), and non-paged memory.
2.3 Disk
The Disk section of the Performance tab shows a graph of the current disk activity, including read and write speeds, as well as a breakdown of activity by individual disks and processes.
2.4 Network
The Network section of the Performance tab shows a graph of the current network activity, including sent and received data rates, as well as a breakdown of activity by individual network adapters and processes.
3. The Task Manager App history tab
The App History tab shows historical usage data for Windows Store apps, including resource usage and network activity. This tab is only available in Windows 10.

3.1 Resource Usage on Task Manager
The Resource Usage section of the App history tab provides a detailed view of the system resources used by Windows Store apps over time. This includes CPU usage, network usage, and metered network usage.
- CPU time: This shows the amount of CPU time an app uses over time, measured in seconds.
- Network: This shows the amount of data sent and received by an app over time, measured in bytes.
- Metered Network: This shows the amount of data sent and received over metered networks, which is charge based on data usage.
You can sort the resource usage data by clicking on the column header by any of these metrics.
3.2 Usage History
The Usage History section of the App history tab provides a graph of the usage history for each Windows Store app installed on your system. This includes CPU usage, network usage, and metered network usage.
You can select which metrics to display on the graph by clicking on the drop-down menu at the top of the section.
3.3 Network Usage details
The Network Usage Details section of the App history tab provides a breakdown of the network activity for each Windows Store app installed on your system. This includes the amount of data sent and received by the app and the duration of the network activity.
You can sort the network usage data by clicking on the column header by any of these metrics.
3.4 Metered Network Usage details
The Metered Network Usage Details section of the App history tab provides a breakdown of the network activity for each Windows Store app installed on your system over metered networks. This includes the amount of data sent and received by the app and the duration of the network activity.
You can sort the metered network usage data by clicking on the column header by any of these metrics.
4. The Task Manager Startup tab
The Startup tab shows a list of applications set to start automatically when Windows starts up. This tab can disable unnecessary startup programs and improve system performance.

4.1 Startup Impact
The Startup Impact column shows each application’s impact on your system’s startup time. The impact is classified into three categories:
- High: These applications significantly slow down your system’s startup time.
- Medium: These are applications that impact your system’s startup time.
- Low: These applications have minimal impact on your system’s startup time.
You can sort the list of applications by Startup Impact by clicking on the column header.
4.2 Status
The Status column shows the current status of each application’s startup configuration. This can be either Enabled or Disabled.
- Enabled: These are currently configured applications to start automatically when your computer starts up.
- Disabled: These are applications not currently configured to start automatically when your computer starts up.
You can enable or disable an application’s startup configuration by right-clicking on the application and selecting Enable or Disable from the context menu.
4.3 Startup Item Details
The Startup Item Details section provides additional information about each startup application, including the application’s name, the publisher, the file path, and the startup type.
- Name: This is the application’s name configured to start automatically.
- Publisher: This is the name of the company that published the application.
- File Path: This is the file path of the application executable.
- Startup Type: This is the type of startup configuration for the application. There are several types, including Registry (Run), Task Scheduler, and Startup folder.
You can sort the list of applications by any of these details by clicking on the corresponding column header.
4.4 Add or Remove Startup Applications
You can add or remove startup applications from the Startup tab using the Task Manager’s context menu.
To add an app to your startup list, right-click on the application and select Add to startup from the context menu. To remove an application from the startup list, right-click on the application and select Disable from the context menu.
5. The Task Manager Users tab
The Users tab lists all the users currently logged into the system and the processes running under each user’s account.

5.1 User Name
The User Name column displays the user account’s name currently logged in to the system. If multiple user accounts are logged in, each account will be listed separately.
5.2 Session ID
The Session ID column displays the unique session ID associated with each user account. This ID identifies and manages the user’s session on the system.
5.3 Status
The Status column shows the current status of each user account. This can be either Active or Disconnected.
- Active: This indicates that the user is currently logged in to the system and actively using it.
- Disconnected: This indicates that the user has logged in to the system but is inactive.
5.4 CPU, Memory, Disk, and Network Usage
The CPU, Memory, Disk, and Network Usage sections display the resource usage for each user account on the system. These sections show the total resource usage for all processes and services associated with each user account.
You can sort the list of user accounts by any of these metrics by clicking on the corresponding column header.
5.5 Processes
The Processes section displays the list of processes associated with each user account. This includes both user-initiated processes and system processes.
You can sort the list of processes by any metrics displayed in the CPU, Memory, Disk, and Network Usage sections by clicking on the corresponding column header.
5.6 Services
The Services section displays the list of services associated with each user account. This includes both user-initiated services and system services.
You can sort the list of services by any metrics displayed in the CPU, Memory, Disk, and Network Usage sections by clicking on the corresponding column header.
5.7 Disconnecting Users
You can disconnect a user from the system by selecting the user and clicking on the Disconnect button. This will log the user out of the system and end their session.
6. The Task Manager Details tab
The Details tab in the Windows Task Manager provides an in-depth view of all the processes running on your system. It displays each process’s name, PID (Process ID), status, and resource usage.
Additionally, it allows you to manage the processes by providing various options like ending a process, changing its priority, and so on.

6.1 Process Name
The Process Name column displays the name of each process running on the system. This includes both system processes and user-initiated processes.
6.2 PID (Process ID)
The PID column displays the unique Process ID associated with each process. This ID is used to identify and manage each process on the system.
6.3 Description
The Description column displays the description of each process. This can help identify the purpose of each process and determining whether it is necessary for the system’s operation.
6.4 CPU, Memory, Disk, and Network Usage
The CPU, Memory, Disk, and Network Usage sections display the resource usage for each process on the system. These sections show the total resource usage for each process, including its child processes.
You can sort the list of processes by any of these metrics by clicking on the corresponding column header.
6.5 Managing Processes
The Details tab allows you to manage the processes running on your system. Right-clicking on a process displays a context menu with various options to manage the process. Some of the options include:
- End task: This option terminates the process immediately.
- Set priority: This option allows you to set the priority of the process, which determines the number of system resources allocated to it.
- Open file location: This option opens the location of the executable file associated with the process.
- Search online: This option performs a web search for information about the process.
6.6 Adding and Removing Columns
You can customize the Details tab by adding or removing columns as needed. Right-clicking on the column headers displays a context menu with various options to manage the columns. Some of the options include:
- Select columns: This option allows you to select which columns to display in the Details tab.
- Resize columns: This option allows you to resize the width of the columns.
- Hide columns: This option allows you to hide specific columns from the Details tab.
7. The Task Manager Services tab
The Services tab in the Windows Task Manager displays the services running on the system. It lists all services, their current status, and the associated process ID associated with each service.
Additionally, it allows you to manage the services by providing various options like starting, stopping, and restarting a service.

7.1 Service Name
The Service Name column displays the name of each service running on the system. This includes both system services and third-party services installed by applications.
7.2 PID (Process ID)
The PID column displays the unique Process ID associated with the process hosting the service. This ID is used to identify and manage the service on the system.
7.3 Description
The Description column displays the description of each service. This can help identify the purpose of each service and determine whether it is necessary for the system’s operation.
7.4 Status
The Status column shows the real-time status of each service. The possible statuses are:
- Running: The service is currently running.
- Stopped: The service is currently stopped.
- Paused: The service is currently paused.
7.5 Startup Type
The Startup Type column displays the startup type of each service. The possible startup types are:
- Automatic: The service starts automatically when the system boots up.
- Manual: The service must be started manually by a user or application.
- Disabled: The service is disabled and cannot be started.
7.6 Managing Services
The Services tab allows you to manage the services running on your system. Right-clicking on a service displays a context menu with various service management options. Some of the options include:
- Start: This option starts a stopped service.
- Stop: This option stops a running service.
- Restart: This option stops and then starts a service.
- Open services: This option opens the Services snap-in in the Microsoft Management Console, which provides advanced service management options.
7.7 Adding and Removing columns
You can customize the Services tab by adding or removing columns as needed. Right-clicking on the column headers displays a context menu with various options to manage the columns. Some of the options include:
- Select columns: This option allows you to select which columns to display in the Services tab.
- Resize columns: This option allows you to resize the width of the columns.
- Hide columns: This option allows you to hide specific columns from the Services tab.
Examples of Task Manager Usage in Solving Problems
- Ending unresponsive programs such as when experiencing Closing 1 App and Shutting Down error.
- Disabling unnecessary startup programs to improve boot time.
- Identifying resource-intensive processes or services.
Limitations of Task Manager for Advanced Troubleshooting
Task Manager is a powerful tool for everyday troubleshooting but has some limitations for advanced users.
- It provides only basic information about processes, which may not be sufficient for in-depth analysis.
- The Task Manager cannot end some system-critical processes. This restriction is in place to prevent accidental system instability.
- Task Manager lacks debugging features.
Due to these limitations, IT professionals or developers may depend on more specialized system monitoring and debugging tools alongside Task Manager.
Additional tips and tricks for using the Task Manager
Here are some additional tricks and tips for using the Windows Task Manager:
- Pressing Ctrl + Shift + Esc on your keyboard immediately opens the Task Manager, skipping the Ctrl + Alt + Del screen.
- Pressing Ctrl + Shift + Esc on your keyboard while holding the Shift key down will open the Task Manager with administrative privileges.
- If you’re unsure what a particular process or service does, search for it online using a search engine like Google or Bing.
- You can customize the Task Manager’s columns and add additional columns to display more information about running processes.
- You can save a snapshot of the current Task Manager view by clicking the More details button and then selecting File > Save as from the menu.